Bitcoin and Gold Diversification Depends on Correlation and Position Size
| Shelf | Bitcoin |
|---|---|
| Date in | |
| Readers | 987 |
Bitcoin and gold can complement each other across market regimes, but their correlation can rise and Bitcoin’s drawdowns remain much deeper.

Bitcoin and gold can play different roles in a portfolio, but their diversification benefit depends on market conditions. Gold has historically cushioned some declines, while Bitcoin has posted stronger rebounds in certain recoveries. That pattern supports a measured combination, not the assumption that the assets reliably offset each other.
The practical distinction is in their risk profiles. Gold’s role is tied to its history as a buffer during contractions; Bitcoin’s potential contribution comes with much larger losses when markets turn down. A portfolio that treats both as equivalent stores of value can miss the exposure it is taking on.
Backtest results depend on the market path
Research from Bitwise found that a portfolio allocating 15% in total to Bitcoin and gold produced a Sharpe ratio of 0.679 over the prior decade. The comparison figures were 0.237 for a traditional 60/40 portfolio and 0.436 for a gold-only allocation.
Those results describe a particular period and sequence of market moves. They don’t establish that the combined allocation will keep the same risk-adjusted performance under different conditions. A Sharpe ratio compresses a portfolio’s returns and volatility into one measure; it doesn’t show whether an investor can tolerate a steep interim loss or whether the assets will hedge each other in the next downturn.

Bitwise examined four stress episodes: 2018, 2020, 2022 and 2025. In each, gold fell less than Bitcoin during the downturn, while Bitcoin led the rebound that followed. In 2022, equities dropped 24.18%, Bitcoin fell 59.87% and gold declined 8.95%. After the 2020 decline, Bitcoin gained 774.94% over the following year, compared with 111.92% for gold and 77.80% for equities.
The pattern points to a possible division of labor: gold may cushion losses during contraction, while Bitcoin may contribute more during a recovery with expanding liquidity. But this is a pattern observed across those episodes, not a permanent feature of either asset. The timing and depth of future downturns and rebounds will shape whether the combination behaves similarly.
Correlation can shift when market drivers overlap
The portfolio case relies partly on Bitcoin and gold having low or negative correlation. That relationship has varied. Bitwise data put their 90-day rolling correlation above 0.5 in 2026, a level recorded only twice since 2015. It reached 0.58, compared with a six-year median of 0.12.
In the same recent period, Bitcoin fell 53% from its October 2025 high and gold declined 28% from its January 2026 high. Both remained between 20% and 30% below their respective records and had closed flat year-to-date, while the Nasdaq-100 reached record highs.
When both assets respond to a shared demand for hard assets or concern about currency debasement, gold may provide less of a buffer against Bitcoin’s decline. A correlation measure doesn’t explain the cause of each price move, and a reading from one window won’t settle how the pair behaves across a full cycle. Still, the elevated reading shows why an allocation built on a fixed correlation assumption can disappoint.
The familiar description of Bitcoin as digital gold is a long-term thesis, not a practical guide to short-term portfolio behavior. Over the period described, Bitcoin’s correlation with the Nasdaq-100 fell from more than 60% to near 33% as its link with gold increased. That movement suggests Bitcoin’s market drivers can rotate; it doesn’t show a stable convergence with gold.
Drawdown risk argues for smaller Bitcoin exposure
Bitcoin’s volatility moderated in 2025, but its losses remained much larger at the extremes. Its annual volatility was 1.86 times gold’s, the first reading below three times in fifteen years. Yet Bitcoin’s worst drawdown from its high during the year was −32.0%, compared with −9.0% for gold. Lower day-to-day volatility, in other words, did not mean comparable protection from a deep decline.
That difference matters for portfolio sizing. A larger position in an asset that can fall sharply may force a holder to sell during stress, precisely when the expected recovery benefit is least useful. The question for an investor isn’t only how much upside Bitcoin added in a historical backtest; it’s whether the allocation can be held through a decline of the scale discussed in the analysis.
BlackRock’s cited allocation range for Bitcoin in a 60/40 portfolio is 1% to 2%, even after a decline of more than 50% from the October 2025 high. In a ten-year analysis, a 1% allocation raised annualized return to approximately 10.9% and volatility to around 10.3%. A 2% allocation brought return to near 11.8% and volatility to 10.6%, with a risk contribution comparable to a large-cap technology stock.

VanEck’s illustrative allocations also keep Bitcoin below gold: 2.5% gold and 1% Bitcoin for a conservative profile, 4.5% and 1.5% for a moderate profile, and 5% and 2% for an aggressive profile. These examples reflect the asymmetry between gold’s cushioning role and Bitcoin’s exposure to much deeper drawdowns.
The analysis suggests Bitcoin’s position should be sized around the possibility of a 50% to 70% decline, while gold’s allocation can be tied to its separate portfolio function. Those figures don’t remove the risk of simultaneous losses. They frame the scale of decline an investor would need to be able to withstand for the proposed combination to work as intended.
A portfolio structure, not a safe-haven promise
The case for combining the assets doesn’t require one to replace the other. Its premise is that gold can retain enough weight to cushion losses while Bitcoin contributes to recovery potential. A 15% combined allocation can look strong in a historical comparison, but the 2026 episode described here showed both assets sharing a risk factor during a decline rather than one offsetting the other.
For crypto users and portfolio managers, the distinction affects how performance claims should be read. Long-term low correlation is historical evidence, not a guarantee of future diversification. Backtests can reveal how an allocation behaved over a selected period, but they cannot ensure the same mix of drawdowns and recoveries will repeat.
Bitcoin remains an asset with elevated tail risk and a history of aggressive recoveries in some liquidity expansion phases. Gold has shown greater resilience as a tail hedge in the episodes discussed. A portfolio that accounts for those differences can treat the assets as distinct exposures instead of relying on the “hard money” label to imply they will move independently.
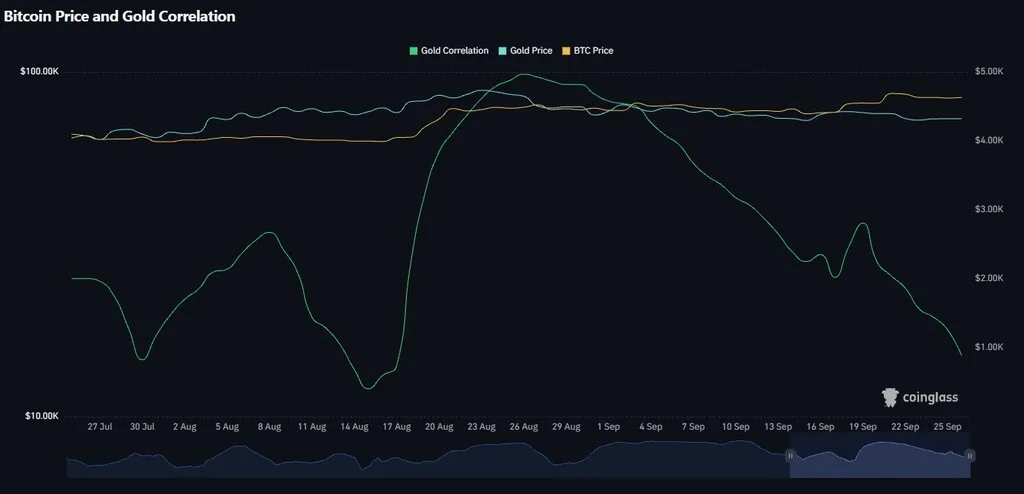
The Bitcoin-gold correlation could return toward zero, or it could remain elevated through a full cycle. The combination’s resilience depends on being sized for either outcome: enough gold to provide a potential buffer and limited Bitcoin exposure that can be held through a severe decline. That balance, rather than a favorable retrospective Sharpe ratio, is the central test for the portfolio thesis.
===