XRP’s 2017–2018 Rally Followed 742 Days of Consolidation, but History Offers No Forecast
| Shelf | Ethereum & Altcoins |
|---|---|
| Date in | |
| Readers | 438 |
XRP once rose sharply after a long trading range. The episode draws attention, but differences between market cycles limit what it can say about future prices.


XRP’s past includes a striking sequence: roughly 742 days in a narrow trading range, followed by a rally that one market commentator describes as a 62,000% gain. That history helps explain why some holders see long stretches of subdued trading as a possible prelude to a major move. It doesn’t establish that the same pattern is forming again, though, and the headline percentage depends heavily on which starting point is chosen.
What the historical chart shows
Vandell Aljarrah, co-founder of Black Swan Capitalist, made the comparison in a post on X. He pointed to XRP’s roughly two-year consolidation before its expansion during the 2017–2018 bull run, arguing that abandoning a position simply because the market has gone quiet can be a mistake.
The weekly XRP/USD chart he shared shows the token trading in an approximate range of $0.004 to $0.011 for about 742 days. XRP then broke out in 2017 and reached a cycle peak in January 2018. The chart depicts a 630-fold increase from the low end of that range to the peak, illustrating why this period remains a reference point in discussions of XRP’s price history.
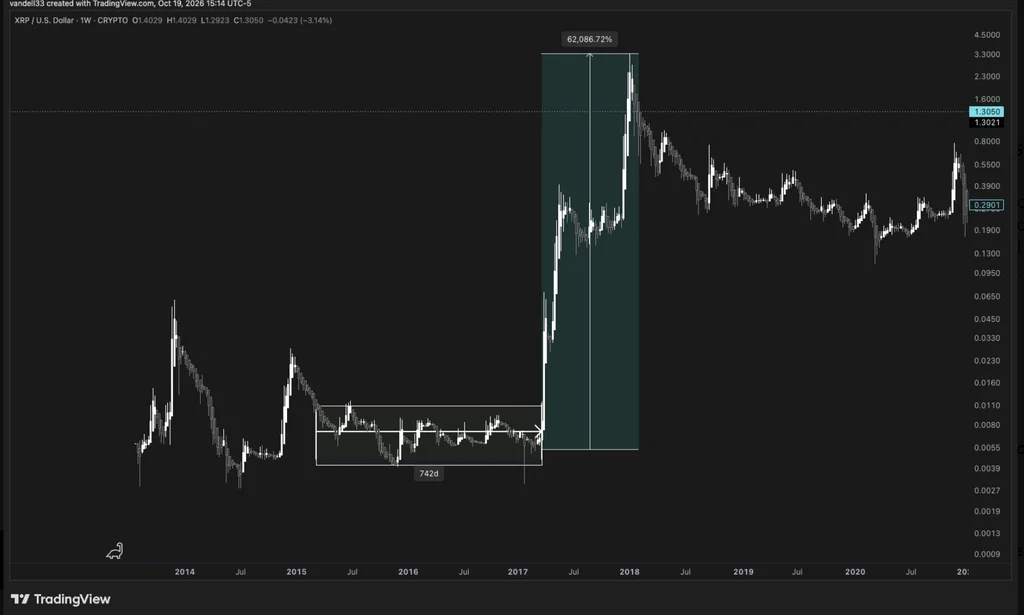
That scale is eye-catching, but percentage gains can describe different moves depending on the baseline. A second commenter estimated a gain of roughly 64,000%, using a starting price near $0.006 and a peak of $3.84. In a follow-up post, Aljarrah said that starting from XRP’s 2014 cycle lows instead would put the increase at approximately 119,000% by the January 2018 peak.
Those figures aren’t necessarily contradictory: they use different starting prices and data points. For a low-priced asset, even a small change in the selected baseline can produce a large difference in the reported percentage. Exchange data and the exact interval being measured also matter. The shared chart and estimates describe past prices; they don’t provide a method for determining when a future breakout might happen.
Why the comparison has limits
The pattern Aljarrah highlights is simple to describe: XRP traded sideways for an extended period, then rose sharply. The harder question is whether that sequence carries useful information about what happens next. A single historical episode can show that a long consolidation preceded a large move once. By itself, it can’t show that long consolidations usually lead to similar gains, or identify the conditions that caused the 2017–2018 rally.
Some members of the XRP community reject the idea that the earlier move is a reliable template. They argue that today’s crypto market differs from the one XRP traded in during that cycle, citing the greater role of market makers and claims of manipulation. These views are part of the debate, not established evidence in the source material. Still, they point to a relevant limitation: market structure and trading conditions can change, so a chart pattern from one period may not carry over intact.
Others focus on XRP’s performance since that historic climb, asking why the token hasn’t produced comparable gains in the years that followed. That question puts the earlier rally in perspective. A dramatic past return can attract attention, but it doesn’t resolve how much the current market differs, what drove the earlier move, or whether those drivers are present now.
Current figures and the hypothetical arithmetic
At the time reported, XRP was trading at $1.31, down 5.2% on the day, according to CoinGecko data. The token was also about 64% below its stated all-time high of $3.65. These are time-specific figures from the source, not a live market update.
Applying the historical 62,000% gain to the reported $1.31 price produces a hypothetical value of $814.81. That calculation shows the arithmetic behind the comparison; it isn’t a price forecast. Repeating a percentage move from a different starting price would also produce a different result, and the calculation says nothing about whether the conditions for such a move exist.
The useful takeaway is narrower than the rally headline: XRP has previously spent a long period trading within a tight range before making a large move, but that episode alone can’t establish a repeatable signal. The figures also show how much the story changes with the chosen baseline. For anyone assessing the comparison, the key questions are which prices and dates underpin the calculation, how today’s market conditions differ, and what new evidence would support treating the historical pattern as relevant.