XRP Chart Forecasts Diverge From Weak Price Action and Bearish Sentiment
| Shelf | Bitcoin |
|---|---|
| Date in | |
| Readers | 541 |
XRP traded near $1.50 as analysts mapped targets from $2.16 to $50, while overhead supply and weak sentiment complicate the bullish setups.


XRP’s chart is carrying bullish projections, but the market evidence in the source is less decisive. The token closed around $1.50 on Monday after a roughly 1.27% decline, and it remained below the $1.55 area. Analysts have outlined targets at $2.16, above $15 and as high as $50, each based on a different chart pattern and set of assumptions.
Brandt’s $2.16 scenario depends on a developing pattern
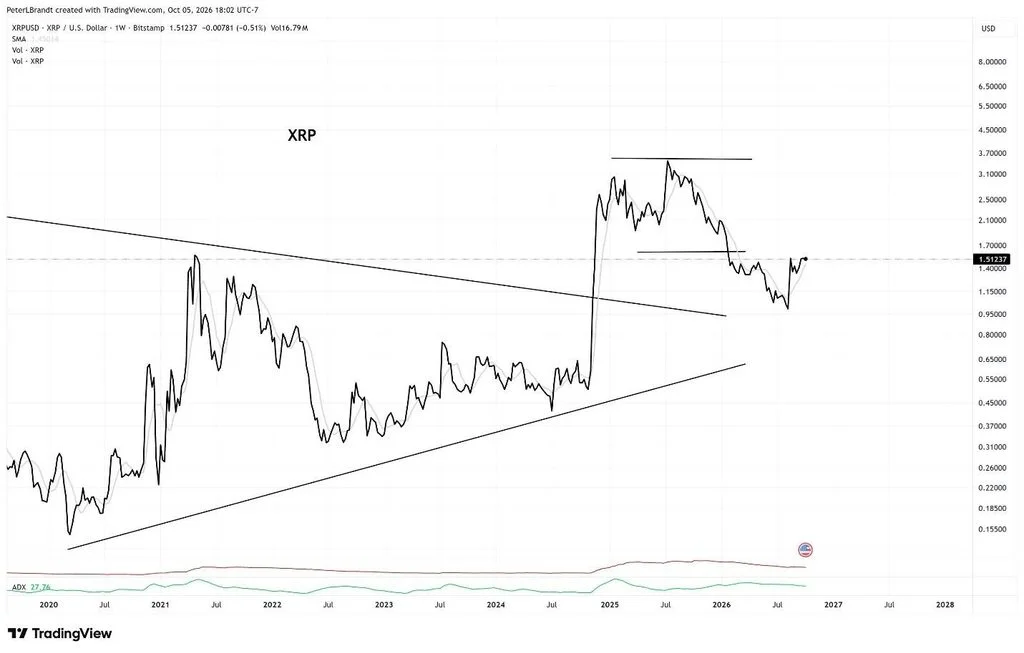
Veteran trader Peter Brandt identified a cup-and-handle formation on XRP’s chart and described it as part of the right shoulder of a larger inverse head-and-shoulders pattern. His measured-move estimate is $2.16, based on the height of the larger formation and daily closing prices. From a price near $1.50, that would amount to roughly 44% upside.
These formations are chart-reading frameworks, not fixed forecasts. A cup-and-handle interpretation depends on how price develops through the pattern, while an inverse head-and-shoulders setup likewise requires the chart to continue forming as anticipated. Brandt said the structures can change with price action, leaving the $2.16 level conditional rather than a guaranteed destination.
The near-term level highlighted in the source is $1.55. XRP had struggled to regain that area, so the gap between its Monday close and the proposed measured move matters: the chart would first need to recover ground before the higher target became relevant. Brandt also flagged substantial overhead supply. In practical terms, holders looking to sell as prices rise could add supply and make a recovery harder to sustain. The source does not quantify that supply or specify where it is concentrated.
Longer-range projections rely on different comparisons
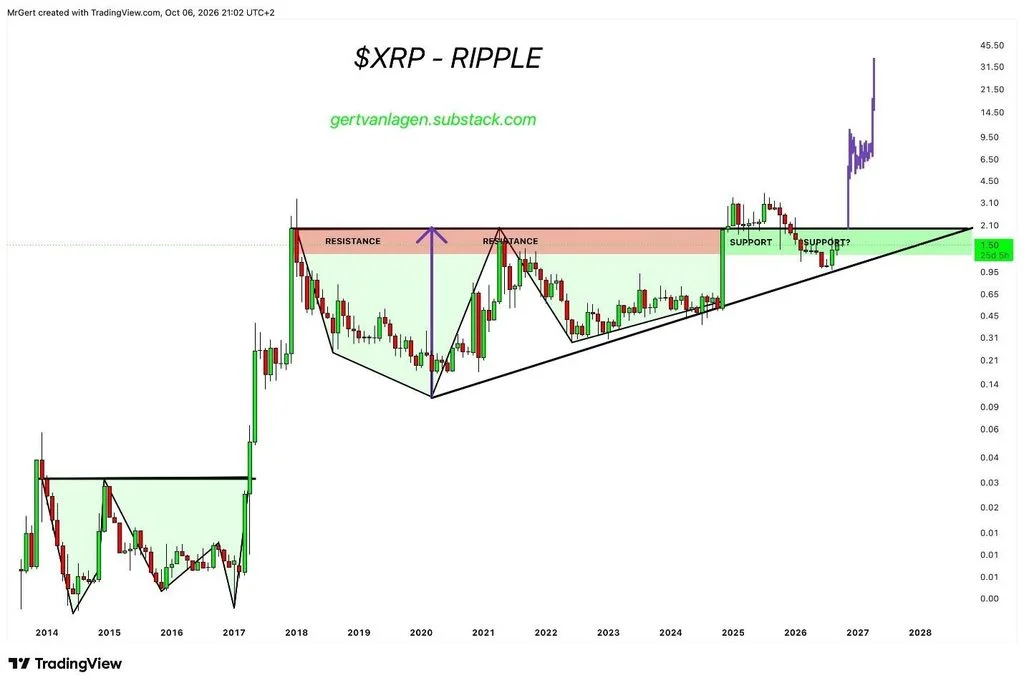
Macro strategist Gert van Lagen presented a much more ambitious scenario, identifying a symmetrical triangle on XRP’s monthly chart and projecting a possible move toward $50. His thesis draws on XRP’s historical performance against Bitcoin: he pointed to the 2017 bull run, when XRP/BTC rose 50 times in two months, and argued that a comparable move could occur in the current cycle.
Van Lagen’s stated projection pairs an XRP price of $50 with a $3 trillion market capitalization. He also said a similar relative move would imply Bitcoin at $450,000. Those figures are part of his scenario, not observed market values or independent confirmation that the pattern will repeat. A past surge in the XRP/BTC ratio provides historical context, but it does not establish that the same magnitude or timing will recur.
Analyst Javon Marks has also maintained a bullish view. His analysis points to a breakout from a descending-triangle structure and a potential measured move above $15, which the source describes as an 896% increase. This projection uses yet another chart structure and horizon, so it should be read separately from Brandt’s $2.16 estimate and van Lagen’s monthly-chart thesis.
Sentiment and price action remain part of the picture
The bullish chart calls surfaced alongside worsening XRP sentiment. Santiment reported in early October that the ratio of bullish to bearish commentary had fallen to 0.67, its lowest reading since August 17. A reading below 1 indicates that bearish commentary outnumbered bullish commentary across platforms including X, Telegram and Reddit.
Some analysts treat unusually negative sentiment as a possible contrarian signal: if selling pressure fades while expectations are subdued, prices may have room to recover. But sentiment measures describe commentary, not market orders, and pessimism alone doesn’t establish that selling has run its course. The reported ratio also doesn’t show whether individual posts reflect meaningful trading activity.
For XRP users and market participants, the immediate distinction is between a chart target and evidence that the market is moving toward it. The token was near $1.50, below the cited $1.55 area, while Brandt identified overhead supply as a possible obstacle. The larger targets depend on patterns continuing to develop and, in van Lagen’s case, on a historical comparison repeating. Those conditions make the forecasts scenarios to monitor, not outcomes demonstrated by the current price action.