East Asia Crypto Markets Diverge as Korean AI Trading and Hong Kong Institutions Grow
| Shelf | DeFi & Web3 |
|---|---|
| Date in | |
| Readers | 459 |
South Korea’s retail traders drove AI token volumes, while Hong Kong drew institutional flows and China’s stablecoin P2P activity accelerated.
East Asia’s crypto markets are moving in different directions. South Korea’s retail traders have made AI-linked tokens a leading trading category; Hong Kong’s licensed services are drawing institutional flows; Japan’s users are increasingly active on decentralized exchanges; and China’s largely peer-to-peer market has seen a sharp rise in stablecoin use. The regional economy contracted modestly from July 2025 through June 2026, in line with a global downturn, but the shifts beneath that aggregate figure were uneven.
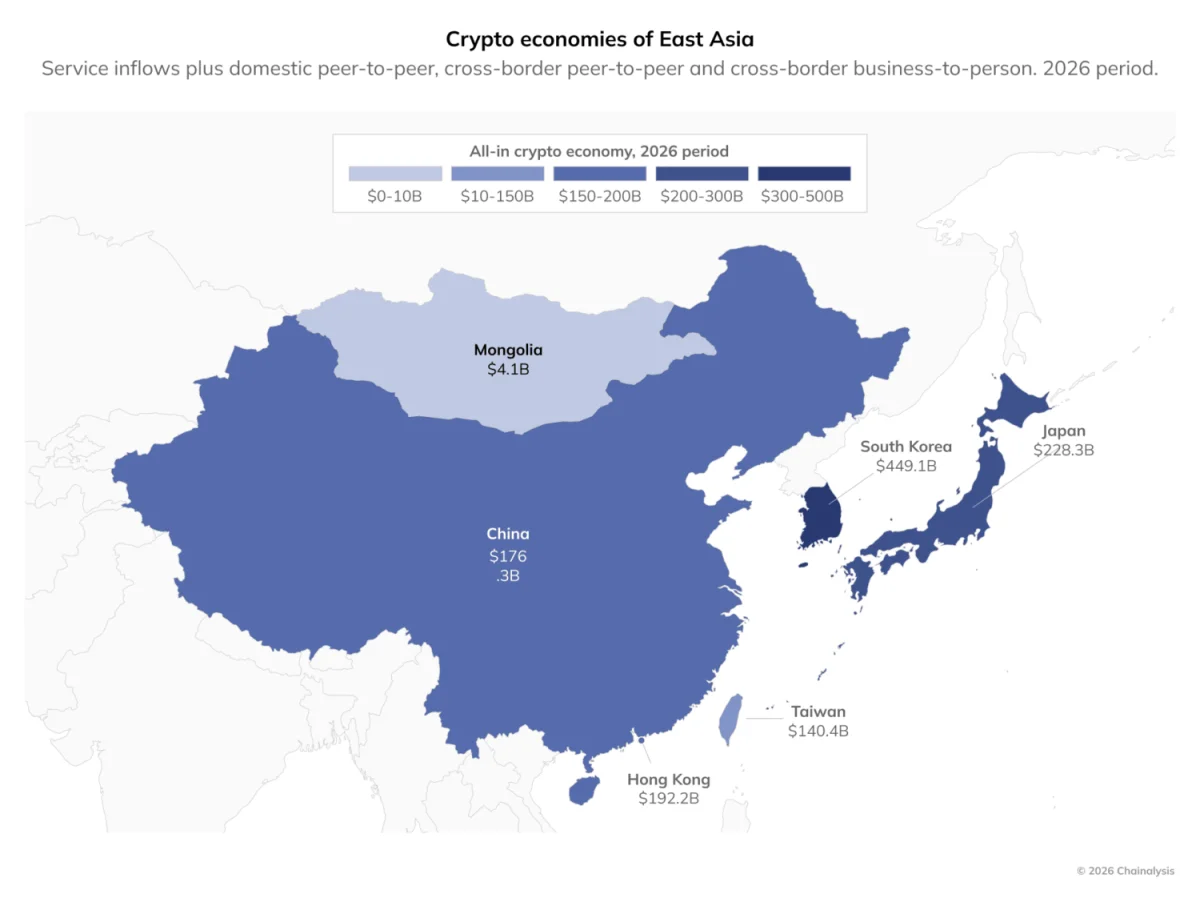
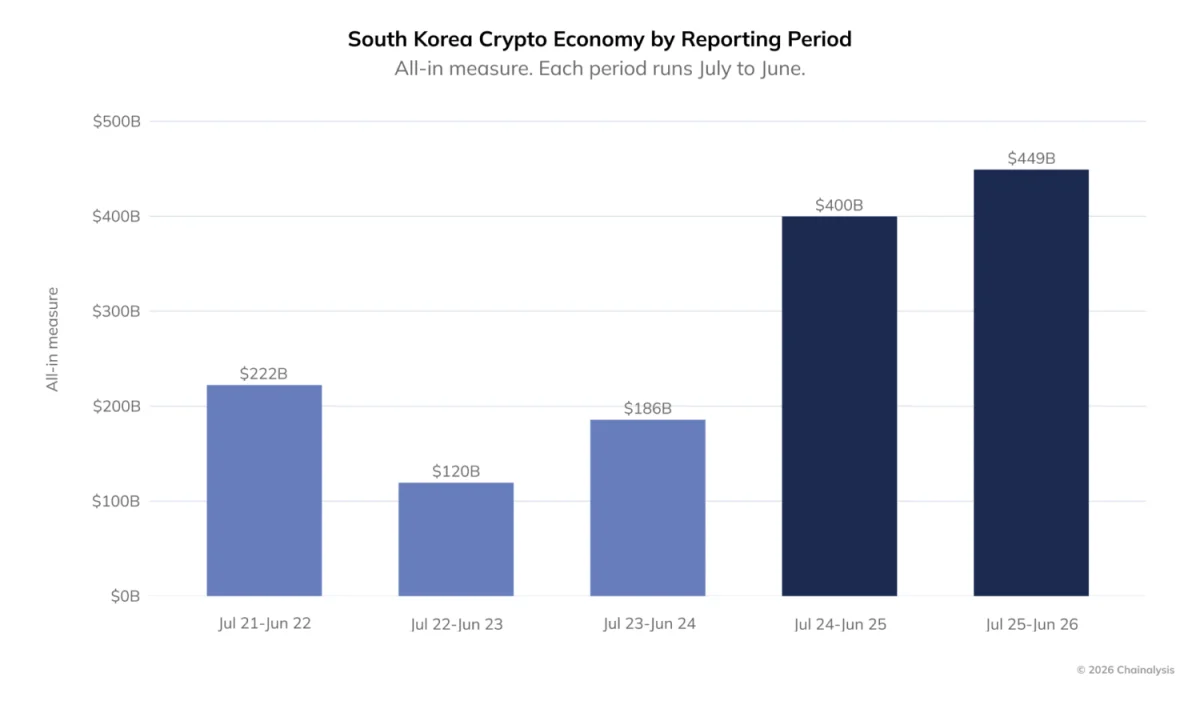
South Korea was the largest market, with a reported $449.1 billion crypto economy. Japan followed at $228.3 billion, Hong Kong at $192.2 billion, China at $176.3 billion, and Taiwan at $140.4 billion. The figures describe distinct patterns of activity: retail trading in South Korea, institutional service flows in Hong Kong, and person-to-person transfers in China. The region’s diversity makes its headline total a poor guide to how crypto is being used in any one market.
Across East Asia, the most consequential question is how different kinds of participation respond to market conditions and access rules. Hong Kong’s institutional platforms received 87% more than in the prior period, while Japanese inflows to decentralized exchanges rose 36%. China’s peer-to-peer economy expanded despite restrictions on crypto services. As Daniel Kim, CEO of Tiger Research, put it, “Asia is that rare region with both grassroots retail depth and institutional firepower.”
South Korea’s retail market turns toward AI tokens
South Korea’s crypto economy grew 12.3% period over period, with an additional $51.1 billion in exchange-related flows. The exchange ecosystem itself grew 16.3%. Francis Kang, executive director of Korea Blockchain Week, attributed much of the activity to a “famously retail-driven” market. A prominent expression of that retail appetite was the AI trade: by June 2026, AI-related cryptocurrencies formed the largest thematically defined category by share of Korean won-denominated trading volume.
The category includes tokens tied to AI-focused projects or infrastructure. Its rise echoed a broader interest in AI-linked assets in South Korea’s stock market, where SK Hynix is a major company producing memory chips used in data centers. The parallel helps explain the market’s attention, but the crypto figures describe trading activity, not evidence that token prices or project outcomes track the performance of AI companies.

The report describes South Korea as an outlier. In June 2026, AI cryptocurrencies accounted for a much smaller share of Japanese yen trading: the Korean won rate was 19.5 times the yen rate. Comparable shares were 0.20% for the Brazilian real, 0.03% for the British pound, and 1.02% for the euro. Those comparisons show how concentrated the category was in Korean won markets, though they don’t establish why traders chose those assets or how long the preference will last.
Trading was spread across several tokens. Worldcoin (WLD) led with $7.41 billion in volume over the period. SAHARA recorded $3.2 billion, VIRTUAL $2.7 billion, BIO $2 billion, and NEAR $1.7 billion. The leading names shifted during the period: VIRTUAL and KAITO were among the 2025 leaders, while Worldcoin and SAHARA later took their place. That turnover suggests traders moved quickly within the theme, so category-level popularity shouldn’t be mistaken for durable demand for any one token.
Institutional participation in South Korea remains at an earlier stage. The report says financial firms have been slow to adopt crypto for payments or investment, citing legislative barriers. In February 2026, restrictions on corporate crypto trading began to ease. Kang described institutional engagement as being in “preparatory mode”: major banks and securities firms have digital-asset teams, and many are running stablecoin, tokenization, or custody pilots.
Retail activity also benefited from the absence of a crypto profits tax during the study period. A 22% tax on crypto profits was scheduled to begin in early 2027, but had been delayed before. In February 2025, the Financial Services Commission set out a roadmap for market access by nonprofits, exchanges, listed companies, and registered professional investment corporations. Corporate investment activity had yet to scale in practice. If the tax change proceeds as scheduled while corporate access widens, the mix of participants could shift. Jinhyeong Jo, a senior examiner at Korea’s Financial Intelligence Unit, said legislative discussions could meaningfully affect retail demand and participation.
Japan combines institutional influence with active retail use
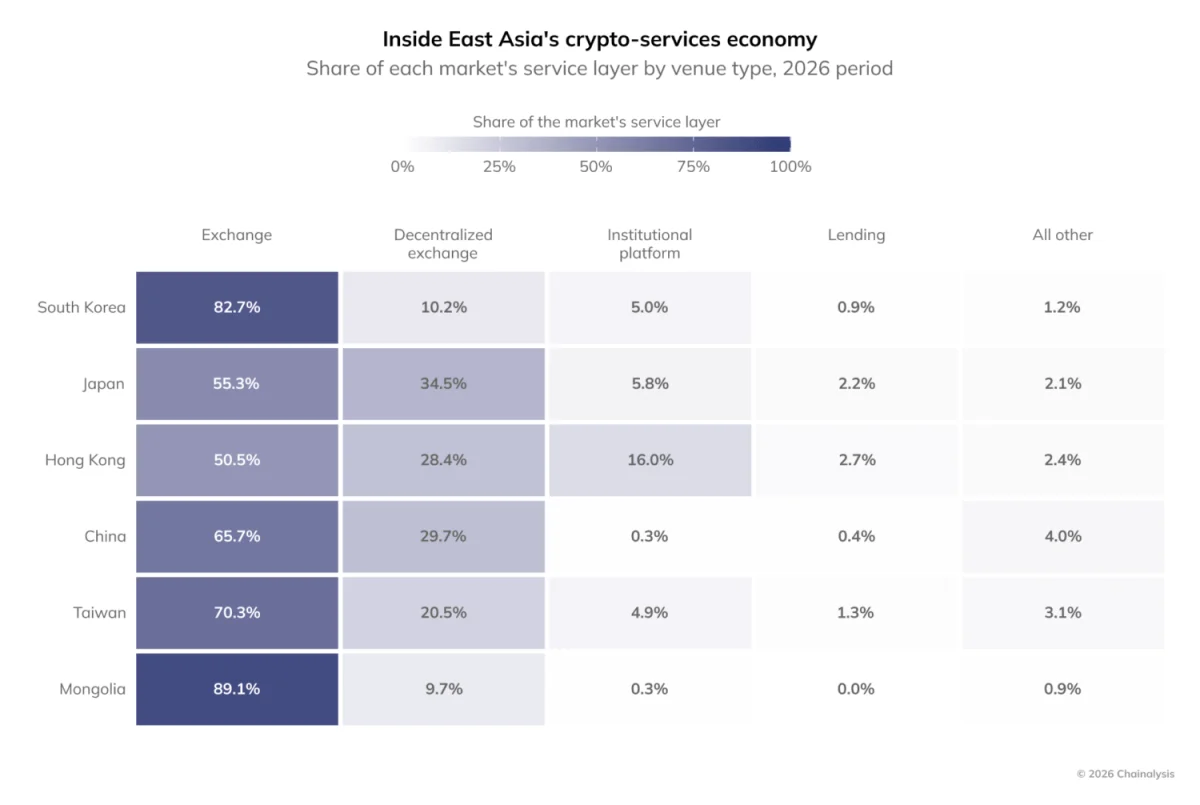
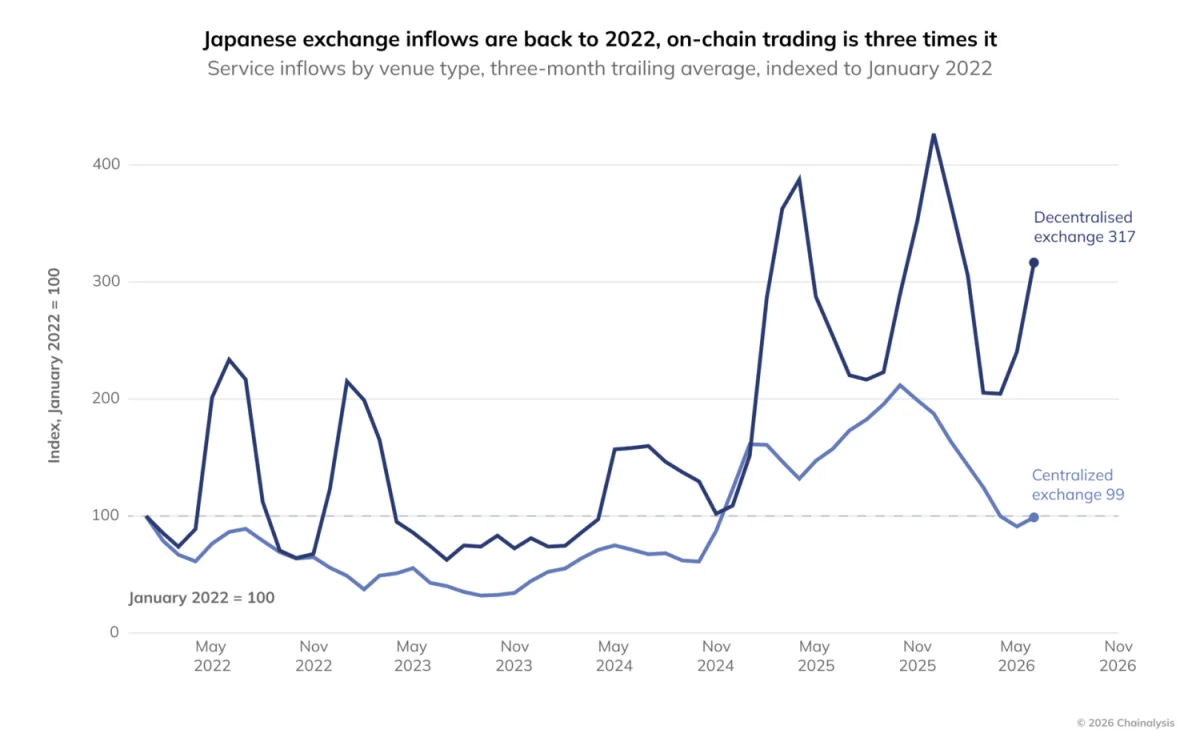
Japan’s $228.3 billion crypto economy is often viewed through the activity of banks and financial firms. Yet the study also found a substantial consumer presence. Roughly one in four people withdrawing from exchanges operating in Japan later deposited funds into decentralized finance protocols. Decentralized exchanges accounted for 34.5% of the country’s crypto services activity, the highest share among regional markets with mature centralized exchange sectors.
Japanese DEX activity had risen by more than 200% since 2022, while centralized exchange activity stayed flat over the comparable period. The report also found that 65.7% of retail DEX swaps fell between $10 and $1,000. Together, those measures point to regular, smaller-scale use alongside the larger role of regulated financial firms. They also complicate the idea that Japan’s crypto market has little consumer activity.
Taishi Sato, CEO of DeFimans, said perpetual futures are the most visible on-chain activity. He linked their popularity to traders familiar with foreign exchange markets and their use of hedging. Sato has seen Japanese traders use platforms such as Hyperliquid alongside equity portfolios to manage directional and macro exposure. That activity places on-chain derivatives within a broader trading toolkit, while also exposing users to the risks of leveraged positions and fast-moving markets.
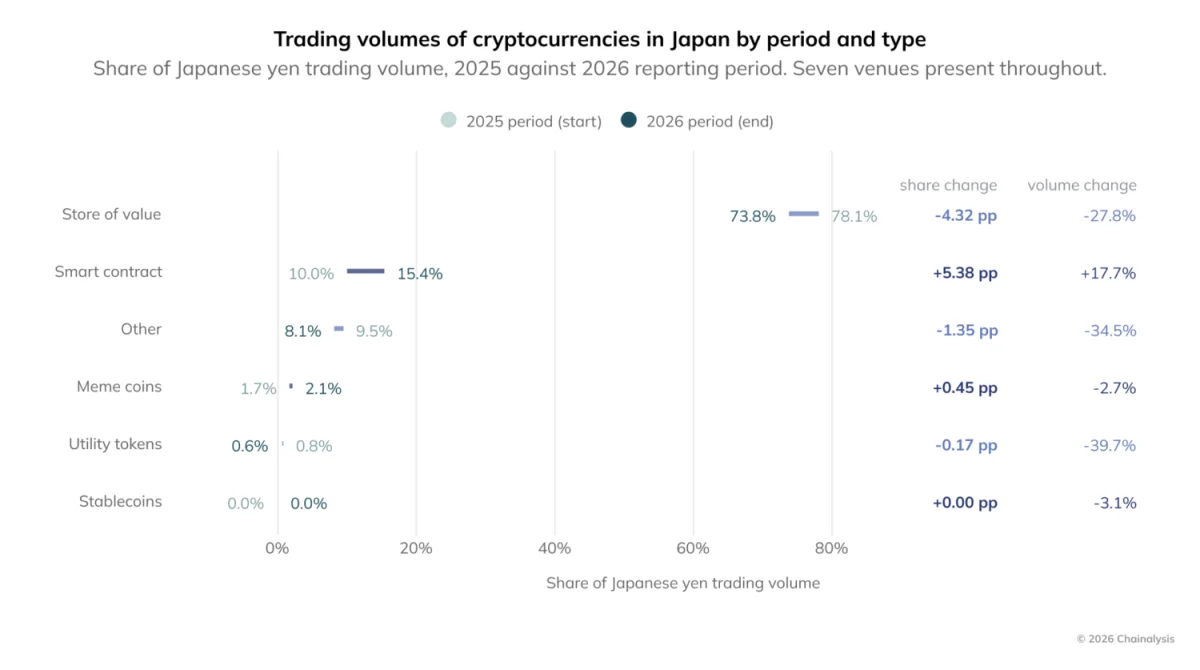
In direct token trading, Bitcoin and other store-of-value assets remained the largest category, representing 73.8% of yen-denominated volume during the study period. Their share fell 4.32 percentage points as total volume in the category dropped 27%. Smart contract tokens, including Ethereum and Solana, moved in the opposite direction: their share rose from 10% in the 2025 period to 15.4%, while their overall trading volume grew 17.7%. They were the only yen-paired asset class to increase in absolute volume period over period.
Tax treatment has been a constraint on Japanese retail participation. During the study period, crypto traders faced a maximum marginal tax rate of 55%. Tax reforms advanced in July 2026, after the period measured by the report. If eligible gains shift to separate taxation at roughly 20%, as expected by local experts, the lower rate could reduce a barrier to participation. Arisa Toyosaki, general manager of Binance Japan, said tax reform and other changes could influence retail sentiment over the following 12 months. The effect remains to be seen.
Japanese institutions are exploring new on-chain services
Japanese banks, brokers, and payment companies are still assessing how digital assets might fit into their businesses, rather than operating those services at scale. Yuya Hasegawa, a market analyst at Bitbank, said firms are beginning to view stablecoins, real-world assets, tokenized deposits, and payments as potential business areas.
Yen-denominated stablecoins are one part of that development. JPYC, introduced in October 2025, could support international remittances and work alongside dollar-backed stablecoins, Hasegawa said. JPYSC, from SBI Group, was launched at the end of the study period in June 2026. Hasegawa described potential uses including over-the-counter trading, settlement for tokenized real-world assets, and foreign exchange.
These products are at an early stage, and their practical reach will depend on adoption and integration with existing services. Sato framed the opportunity as connecting established finance with on-chain markets, including making the basis between them tradable for institutions. How those links develop, alongside the effect of tax changes on retail activity, will help determine the shape of Japan’s crypto economy in the next reporting period.
Hong Kong attracts institutional service flows
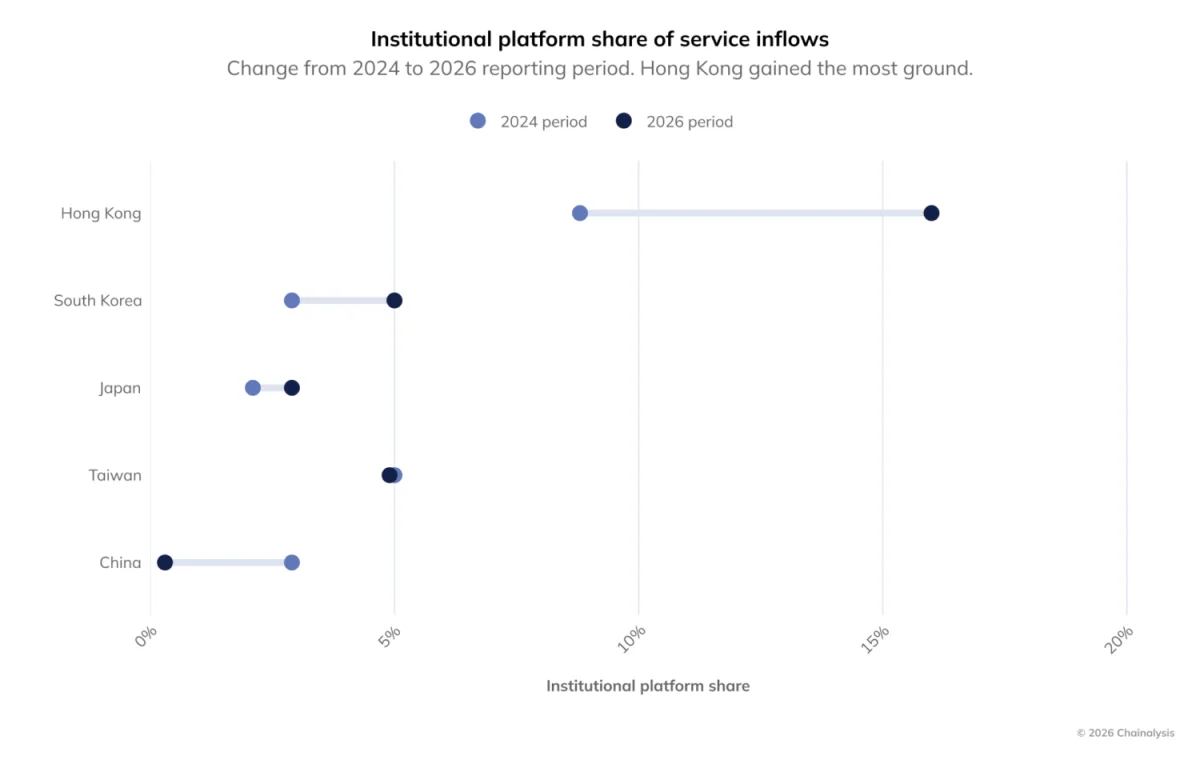
Hong Kong’s $192.2 billion crypto economy stands out for its institutional composition. Institutional platforms—including over-the-counter desks, custody providers, and market makers—accounted for 16% of service inflows during the period, up from about 9% two years earlier. No other East Asian market exceeded 6%. Custody and prime brokerage providers, together with market-making desks, represented 85% of that institutional category.
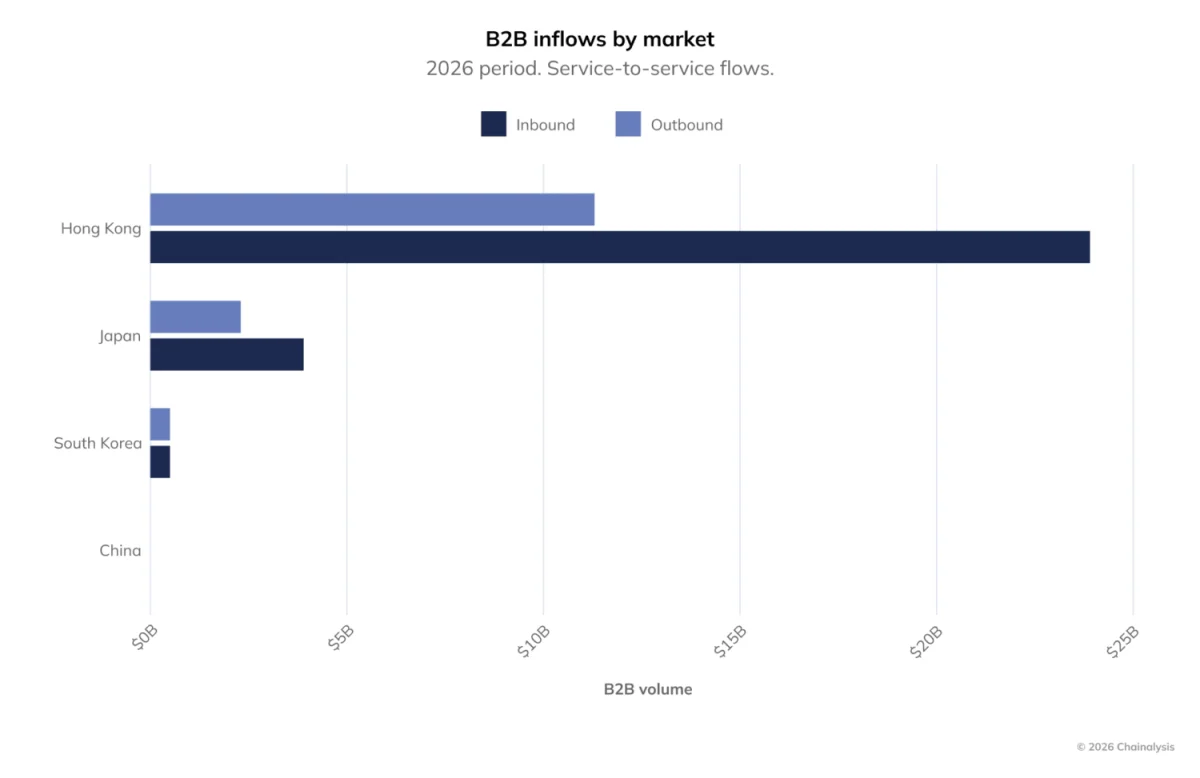
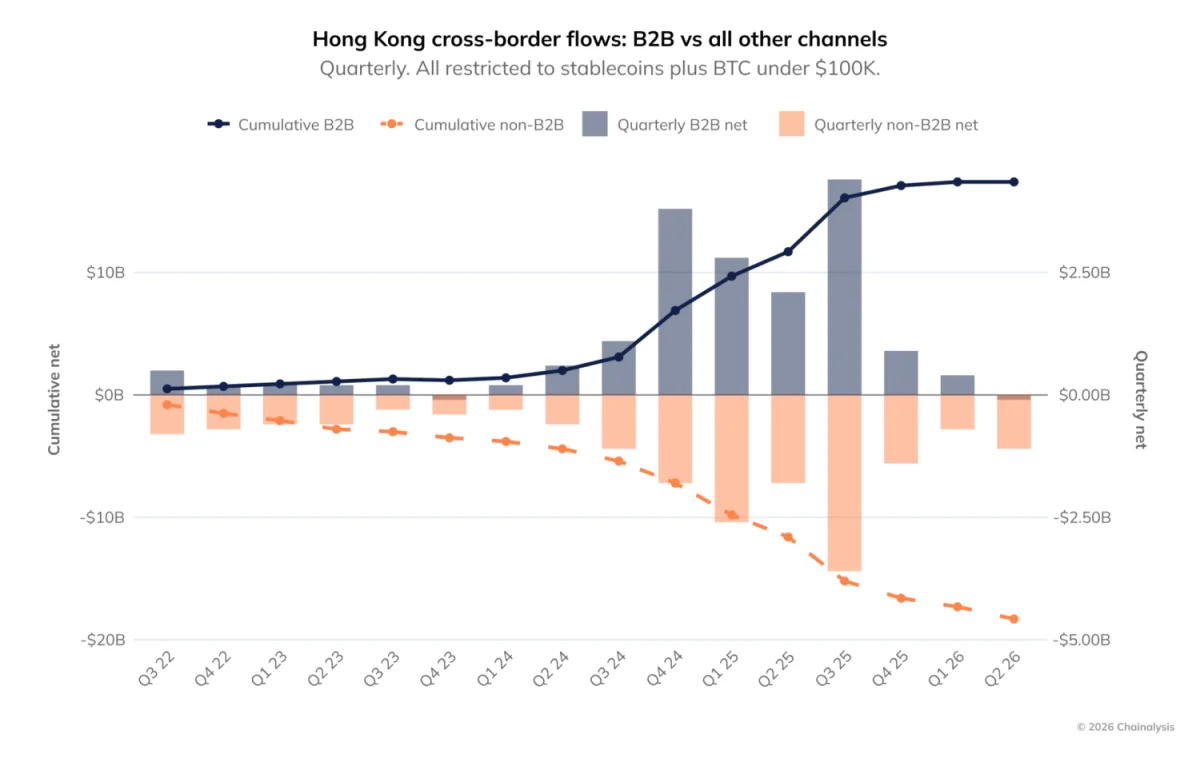
The figures align with Hong Kong’s role as a cross-border settlement center for institutional trades. The city received nearly $24 billion in inbound service-to-service transfers, around six times Japan’s total and 44 times South Korea’s. Outbound service flows were roughly $11 billion, indicating substantial movement in both directions. Cumulative net business-to-business inflows reached $17.4 billion by mid-2026.
The composition of flows matters as much as the totals. From mid-2022 onward, service-to-service transfers were positive on a net basis, while non-business-to-business channels were consistently negative. In other words, institutional service flows arrived as wallet-based activity left. This pattern is consistent with capital settling through licensed services, though transfer data alone cannot show what each participant intended to do with the assets.
Hong Kong’s approach has centered on licensed digital-asset services and market testing with institutional participants. The city issued its first stablecoin licenses in 2026. Its planning documents identify stablecoins, tokenized finance, and central bank digital currencies as priorities. SB Seker, Binance’s head of APAC, said Hong Kong’s recent development showed that clearer rules and financial activity could advance together. QCP Group has said the direction may favor larger operators with stronger controls and licenses, raising the bar for smaller firms while potentially strengthening confidence in the market.
That structure gives Hong Kong a different profile from nearby markets, but it also concentrates activity among service providers operating within a defined perimeter. The distribution of flows will be worth tracking: a high institutional share says little by itself about the resilience of those businesses or the extent to which activity reaches users outside institutional channels.
China’s P2P stablecoin use expands
China’s crypto economy is harder to measure because crypto services are restricted and local activity is not primarily routed through exchanges. The report estimates a market of at least $176.3 billion for the study period, while acknowledging that the actual figure may be higher. Peer-to-peer activity accounted for 59.1% of the estimated total, a 3.5-fold increase in its share from the prior period.
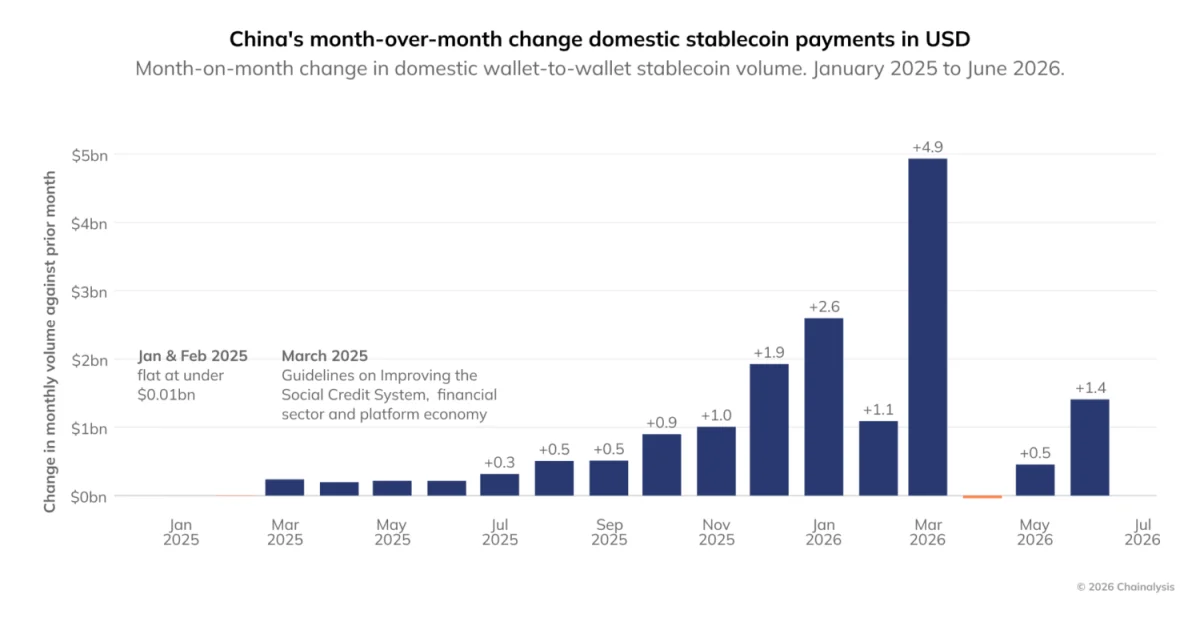
A sharp rise in domestic stablecoin payments began around March 2025. Monthly additions moved from roughly $240 million that month to nearly $5 billion a year later. The report describes 13 consecutive complete months of positive growth. This is a pattern of sustained acceleration rather than a single jump, though the figures do not identify every user or explain their reasons for transacting.
One possible explanation offered by the report is the expansion of China’s social-credit framework into finance and internet activity in March 2025. The timing overlaps with the observed change in stablecoin use, but it doesn’t prove that one caused the other. The report proposes that people who lose access to conventional payment services, or who want to avoid monitored channels, may turn to crypto. These remain hypotheses, not confirmed descriptions of user behavior.
Small-transfer data provide another view of the change. From March 2025, stablecoin transfers under $100 grew 996%; transfers from $100 to $1,000 grew 1,057%; and those from $1,000 to $10,000 grew 1,321%. The number of unique wallets sending stablecoin P2P transactions rose 43-fold between Q1 2024 and Q2 2026. Those numbers point to a widening pool of activity, but wallet counts do not necessarily correspond one-to-one with people.
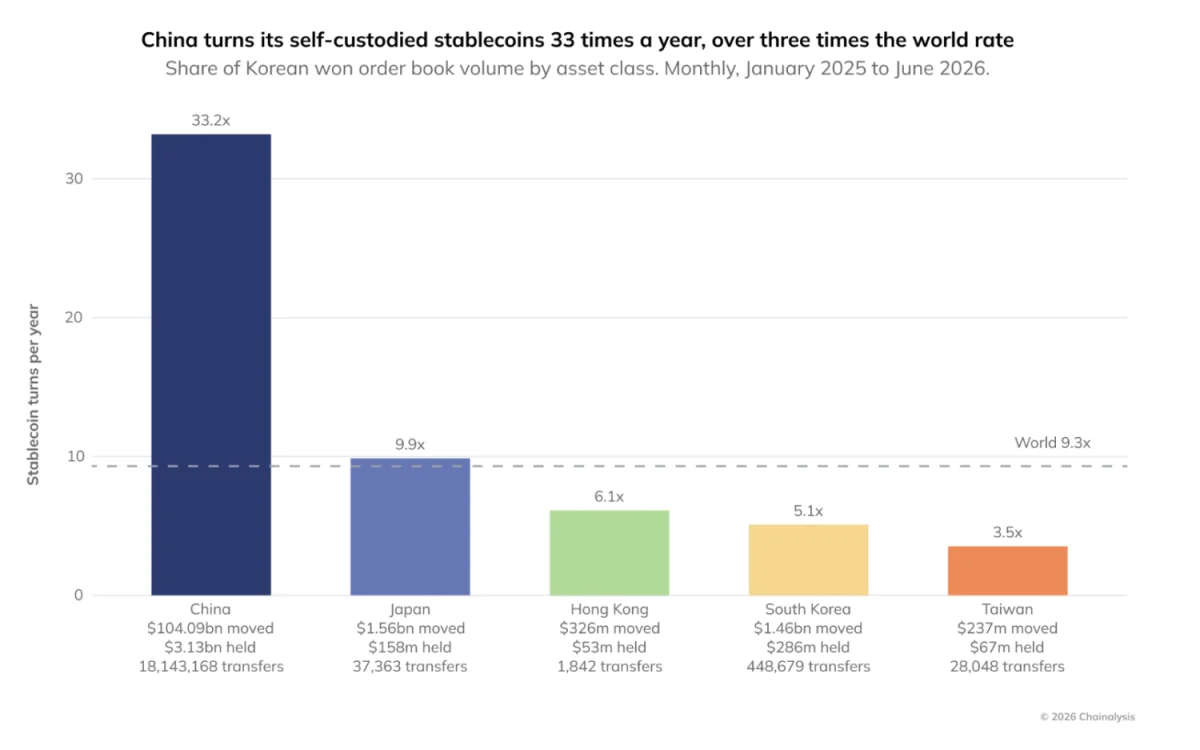
The reported velocity of stablecoins in China was 33.2 times a year, compared with a global average of 9.3. The corresponding rates were 9.9 in Japan, 6.1 in Hong Kong, 5.1 in South Korea, and 3.5 in Taiwan. Against average self-custodied stablecoin holdings of $3.1 billion, the report counted $104.1 billion moving across 18.1 million transfers during the period.
High turnover is consistent with users treating stablecoins as working funds for payments, rather than holding them mainly as a store of value. It does not establish that these assets have become a dependable payment rail. P2P use may expose participants to risks around custody, counterparties, access, and the ability to convert funds. The source data also leave uncertainty about the full size and purpose of activity in a market where exchange-based measurement is limited.
Different rules, different channels
East Asia offers a sharp comparison between markets where crypto activity is routed through supervised services and one where peer-to-peer use dominates. Hong Kong’s net institutional inflows reached $17.4 billion by mid-2026, while South Korea’s expansion was largely retail-driven. Japan combines established financial firms with rising DEX use. In China, restrictions on crypto services coexist with rapid growth in stablecoin transfers between individuals.
These patterns don’t settle whether supervised access brings every form of activity into licensed channels, or whether some activity continues elsewhere. Nor does a prohibition appear to have eliminated crypto use in China: the reported wallet and transfer measures moved sharply higher. The practical effects of access rules vary with market structure and user needs.
South Korea’s scheduled tax change and broader corporate access could alter the balance between retail and institutional activity. In Japan, tax reform and new yen stablecoins may influence participation, though their effects remain uncertain. Hong Kong’s institutional flows and China’s P2P growth will provide different measures of how those markets develop. The next reporting period should show whether today’s shifts persist, and whether the region’s crypto activity becomes more concentrated in institutional services or continues to expand through retail and peer-to-peer channels.
Regional figures at a glance
For July 2025 through June 2026, the reported crypto economy totals were $449.1 billion for South Korea, $228.3 billion for Japan, $192.2 billion for Hong Kong, $176.3 billion for China, and $140.4 billion for Taiwan. South Korea grew 12.3% period over period. Hong Kong’s institutional platforms captured 16% of service inflows, while Japan’s DEX share reached 34.5%. China’s domestic P2P activity made up 59.1% of its estimated economy.
Those measures track different parts of the market, so they should not be read as directly interchangeable indicators of adoption. An economy estimate, a share of service inflows, a trading-volume category, and a wallet count each capture a different behavior. Taken together, however, they show why East Asia’s crypto activity can’t be understood through a single regional growth rate: market structure and user behavior are changing on separate tracks.