Crypto Activity Fell Just 1.6% as the 2026 Bear Market Cut Market Value in Half
| Shelf | Bitcoin |
|---|---|
| Date in | |
| Readers | 915 |
Crypto market value fell 50%, but measured on-chain activity slipped 1.6%. Stablecoin transfers and peer-to-peer use helped sustain flows.

A 50% contraction in crypto market value translated into a 1.6% decline in measured on-chain economic activity during the 12 months ending June 30, 2026. The gap points to a shift in what keeps crypto moving: smaller transfers, stablecoin payments and direct wallet activity held up while price-sensitive service flows weakened.
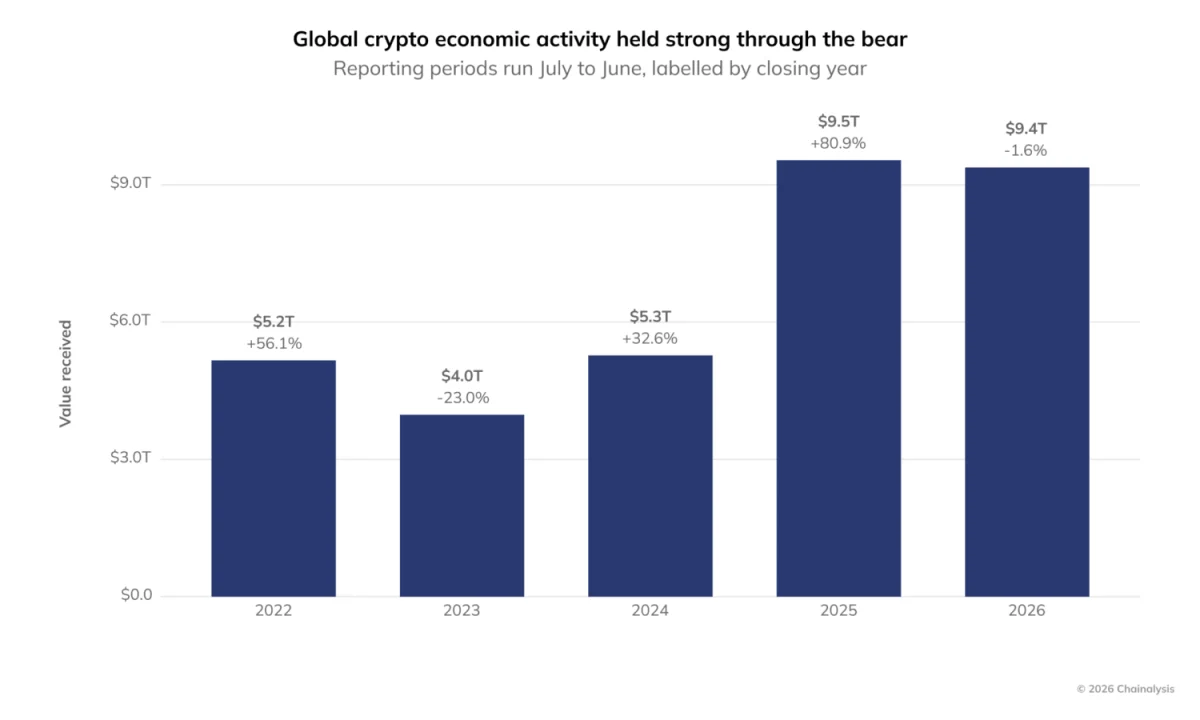
The seventh edition of Chainalysis’ Geography of Crypto report estimates that activity across its measured crypto economy eased from $9.5 trillion in the 12 months ending June 30, 2025, to $9.4 trillion in the following year. The market capitalization of crypto assets, meanwhile, dropped by about 50%, or $2.1 trillion. Bitcoin reached an all-time high during the period, then fell $67,000 from its peak to its largest dollar-value retreat.
The contrast is notable against the previous bear-market period described in the report. In 2023, measured activity fell 23%, or $1.2 trillion, following a much smaller $0.3 trillion contraction in market capitalization. In 2026, the activity decline was about $0.1 trillion despite the $2.1 trillion market-value drop. The report’s interpretation is that crypto use has diversified beyond trading: payments, savings and transfers can continue even when token prices fall.
The measurement is a conservative estimate, not a complete count of every crypto transaction. Its figures exclude transfers that cannot be confidently assigned to a country and omit some activity between personal wallets. Within those limits, the report offers a view of how different transaction types responded to the downturn.
Retail transfers grew as larger flows held up
Transfers into crypto services worth less than $100 increased 78.4% year over year, while transfers between $100 and $1,000 rose 58.6%. These retail-sized flows totaled $273 billion, a small part of the nearly $10 trillion in measured activity. Their growth nevertheless suggests that smaller users continued to interact with crypto services during the downturn.
Transfers worth $1 million or more declined 7.2%. That was a relatively limited fall given the scale of the market’s price retreat. The figures describe transaction value, which can move with asset prices as well as with the number and size of transfers. A dollar-valued measure can therefore show less activity even when users move the same quantity of a token after its price falls.

Stablecoins expanded across borders
Cross-border stablecoin transfers rose 77.5%, from $124.2 billion to $220.3 billion. The report’s conservative estimate of monthly cross-border stablecoin value more than doubled, increasing from $11 billion in January 2025 to $24 billion in June 2026. The authors say actual volumes are likely higher because their method counts only transfers for which both the sending and receiving countries can be identified.
The average transfer was about $3,000, a size the report associates with everyday payments rather than large institutional movements. Such transfers can cover supplier payments, money sent to family, or savings moved out of a currency its holder has lost confidence in. Stablecoins’ dollar-linked value also means their transaction value is less directly exposed to crypto price swings than transfers in volatile assets.
“Activity has become consistent, routed through wallets in a steady rhythm rather than in bursts,” Philip Gradwell, Tether’s vice president of economics, told the report’s authors. “That is the signature of trade and business activity, not speculation.”

Cross-border flows are organized into corridors, meaning the routes between sending and receiving countries. The top quartile of corridors accounted for 96.1% of stablecoin value and grew 70.8% during the period. Activity also spread into routes that had previously seen little volume: the bottom three quartiles carried $8.66 billion, compared with $0.26 billion before the 2026 period.
The report identified 4,708 new corridors, which together carried $2.64 billion. Much of the new activity involved USDT, the largest stablecoin by market capitalization. Gradwell described its reach as particularly relevant to users with limited access to conventional payment options. He said USDT costs an average of one cent per transaction, settles instantly and can be used with a phone. These are his characterizations; the report does not provide a separate comparison of fees or settlement times across payment systems.

The corridor total has an important limitation: transfers are excluded when the data do not reveal where either end is located. Wallets that cannot be placed, or transaction routes that conceal one end, are not counted. The $220.3 billion figure should therefore be read as a floor for the cross-border stablecoin activity the methodology can attribute.
Direct wallet transfers gained share
Value flowing into exchanges, decentralized finance protocols and other crypto services fell 4.3%, from $9.30 trillion to $8.90 trillion. At the same time, domestic transfers directly between personal wallets climbed 302.9%, from $56.8 billion to $228.7 billion. Peer-to-peer activity’s share of the combined total rose from 0.6% to 2.5%, with gains in all eight regions covered by the report.

The split between channels reflects what people move through them. Service inflows often include trading and purchases of crypto, both of which can contract when prices fall and market sentiment weakens. A payment in a dollar-pegged stablecoin is tied more closely to the amount the sender needs to transfer than to the market price of another token.
Stablecoin inflows to services rose 5.3% even as total service inflows declined. Across all assets, domestic peer-to-peer transfers fell 19.7%, but their stablecoin component rose 377.7%. By the report’s estimate, stablecoins made up 96% of peer-to-peer activity, while services handled a broader mix of assets and uses. The overall peer-to-peer increase and the decline in all-asset domestic transfers refer to different measures in the report; the latter comparison isolates activity within the domestic channel.
Stablecoin balances stayed comparatively steady
The total dollar value of measured crypto balances followed market prices down, falling from a September 2025 peak of $0.86 trillion to $0.44 trillion in June 2026. Stablecoin balances, however, stayed between $98 billion and $109 billion across the nine-month drawdown. The value of other measured assets declined 55.6%.
Stablecoins represented 22.5% of global measured balances by June 2026. The report attributes that higher share mainly to falling values in the rest of the market, rather than a large increase in stablecoin holdings. The pattern follows a longer expansion: stablecoin balances grew 72.5% from December 2022 to September 2025, then remained near their level through the drawdown.

Brazil leads the new adoption index
Brazil ranked first in the report’s grassroots adoption index, with a reported crypto economy of $252.5 billion. It did not place first in any single category, but ranked among the top four in all four: second for cross-border flows, third for service flows, third for domestic peer-to-peer activity and fourth for balances. The ranking rewards consistency across measures, which helps explain why Brazil placed ahead of countries with stronger results in individual categories.
The United States ranked second overall, leading in service flows and balances but placing 20th in domestic peer-to-peer activity and 11th in cross-border flows. Nigeria came third overall, ranking first in both peer-to-peer and cross-border flows, but 18th in service flows and balances. The results show how different patterns of use can produce similar overall positions.
The top 20 overall rankings were Brazil, the United States, Nigeria, Japan, the Republic of Korea, India, Ukraine, Thailand, South Africa, Canada, Mexico, China, Germany, Indonesia, Australia, the Russian Federation, the United Kingdom, Viet Nam, the Philippines and Türkiye.
Regional activity also diverged. Latin America’s measured crypto economy grew 9.8% over the period, which the report links to greater stablecoin use and crypto’s role as a hedge against currency volatility. Sub-Saharan Africa led the regions in growth, with especially strong peer-to-peer activity. These regional results sit alongside the global decline and show that the downturn did not affect every market or transaction type in the same way.

How the index is built
The index combines four sub-indexes: service inflows, domestic peer-to-peer transfers, cross-border transfers and on-chain balances. Service inflows cover value received by centralized exchanges, decentralized finance protocols and other crypto services, weighted by a country’s GDP per capita. Domestic peer-to-peer activity counts value transferred between personal wallets within one country. Cross-border flows include person-to-person, person-to-service, service-to-person and business-to-business routes. The balance measure combines geolocatable personal wallets with holdings at selected service types, including exchanges and peer-to-peer exchanges.
For the 117 countries with sufficient data, the researchers first adjust raw values using purchasing power parity, then place each country’s score on a common scale from zero to one through min-max normalization. The overall index score is the geometric mean of the four normalized scores. That approach gives weight to balanced performance and limits the effect of a country’s strength in one category when its results in the others are weaker.
The index’s adoption score and the report’s estimate of a country’s crypto economy are related but distinct measures. The index uses four categories, including balances. The economy estimate combines service inflows, domestic peer-to-peer transfers and cross-border transfers into personal wallets. It aims to sit between a measure of locally bought and sold goods and services and a measure of financial flows such as trading volume.
Attribution choices shape the totals
Personal wallets are assigned to countries using behavioral clues, including interactions with exchanges serving one country. Services present a harder problem: one set of on-chain addresses can hold funds for users in many places. The researchers distribute service activity among countries according to each country’s share of that service’s website traffic. The same approach is used for balances held by services.
They then adjust traffic shares using the square root of each country’s GDP per capita. The rationale is that a site visit from a higher-income country may correspond to a larger transaction, while using the square root keeps income from dominating the allocation. This changes how a service’s total is divided among countries; it does not change the global amount assigned to that service.
The report illustrates the adjustment with one major exchange in June 2026. South Korea and India each represented 8.1% of its web traffic, initially corresponding to $9.71 billion apiece out of $119.30 billion received that month. After adjustment, South Korea’s estimated share rose to 11.6%, or $13.87 billion, while India’s fell to 3.2%, or $3.78 billion. The report cites GDP per capita of $36,239 for South Korea and $2,695 for India, a 3.7-fold difference in their square-root-weighted values.
Web traffic remains an imperfect proxy. The researchers say they attempted to remove virtual private network and bot traffic, but acknowledge that this filtering can fail. Their dataset covers hundreds of millions of crypto transactions and more than 13 billion web visits; they also compare results with input from local crypto specialists and operators.
What the crypto economy includes
The economy estimate counts value arriving at its destination in three categories: service inflows; domestic transfers between personal wallets; and cross-border transfers into personal wallets. Each transfer is counted once. Transfers from personal wallets into services, and transfers between services, are included in service inflows rather than added again as separate activity.
Stablecoin transfers count at any size. Bitcoin transfers between personal wallets count only below $10,000 for domestic activity and below $100,000 for cross-border activity. The report says these thresholds help capture payments and remittance-like activity while limiting distortions from large Bitcoin movements and the way unspent transaction outputs can pass value between counterparties and change addresses. Larger Bitcoin transfers and some other assets may represent real economic activity, but they are excluded from these categories.
Transfers with uncertain country attribution are also left out. The authors therefore describe the economy figures as a lower bound. Personal-wallet data begin in July 2022, so earlier figures cover service activity alone and cannot be compared directly with the fuller measure available from the 2022 reporting period onward.
Each reporting period runs from July 1 through June 30 and is named for the year in which it ends. The 2026 period spans July 1, 2025, to June 30, 2026; the 2025 period covers July 1, 2024, to June 30, 2025. Together, the new index and the activity breakdown suggest that stablecoin payments and direct transfers are becoming more visible parts of crypto’s use during market stress, even as asset values remain highly exposed to price swings.
The 2026 Geography of Crypto Report
Reserve your copy