XRP Forecasts Diverge for November 1 as Price Holds Near $1.31
| Shelf | Bitcoin |
|---|---|
| Date in | |
| Readers | 920 |
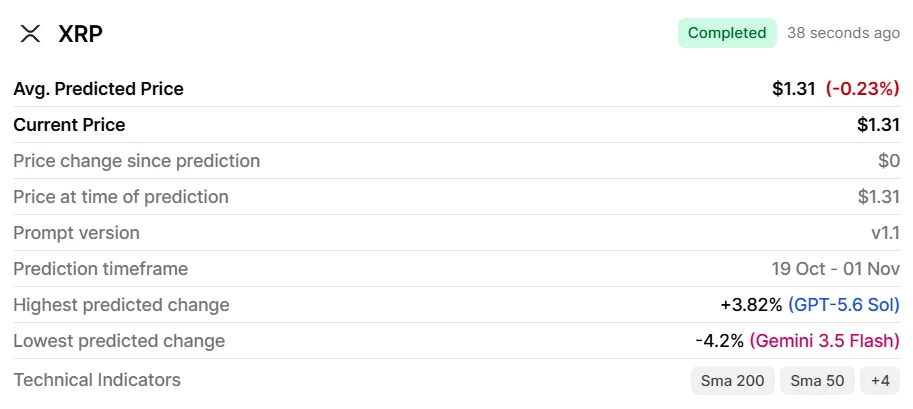
Five AI models put XRP between $1.26 and $1.36 for November 1. A separate chart analysis hinges on whether the token holds $1.25.

Five AI models assessed by Finbold put XRP between $1.26 and $1.36 for November 1, 2026, with forecasts split between a modest decline and a partial rebound. The range captures uncertainty around the token’s near term direction: even the highest model estimate would leave XRP below its late September level, while a separate technical analysis points to $1.25 as a level to watch.
Finbold’s predictive system considered technical indicators including oscillators, moving averages and the relative strength index (RSI). Its aggregate estimate put XRP at $1.31 on November 1, a 0.23% decline from the $1.31 price reported on October 19. That is effectively a flat forecast, rather than a call for a substantial recovery or further drop.
Five models, three bearish and two bullish
The individual estimates vary more than the combined figure suggests. Google’s Gemini was the most bearish, projecting a 4.2% decline to $1.26. ChatGPT-5.6 Terra forecast $1.29, down 1.91% from the October 19 price, while DeepSeek projected a 1.15% decrease to $1.30. Those three models therefore anticipated that XRP would remain near its reported level or lose some ground.
The other two estimates leaned upward. OpenAI’s Luna projected a 2.29% rise to $1.34, and Sol put the token at $1.36, a 3.82% gain and the highest target among the five. The spread from $1.26 to $1.36 is ten cents. These are model outputs, not observed prices, and the source does not provide details on how the models were weighted, how they were calibrated, or how their past forecasts performed. The range is best read as a snapshot of differing estimates rather than a precise measure of XRP’s likely trading path.
That distinction matters when a forecast draws on technical indicators. Oscillators, moving averages and RSI describe patterns in historical market data; they do not establish what will happen next. Results can also depend on the time period and inputs chosen. The information provided does not specify those settings, so readers cannot reproduce the analysis or compare the forecasts on a shared methodological basis.
Recent price movement frames the estimates
XRP had gained more than 56% from mid-August through late September, reaching close to $1.57, before turning lower. The source reports an overall decline of 16.18% from that run-up and an 11.68% drop during October, to $1.31 at the time of publication. The recent retreat helps explain why most of the models did not project a return to the late September high within the forecast period.
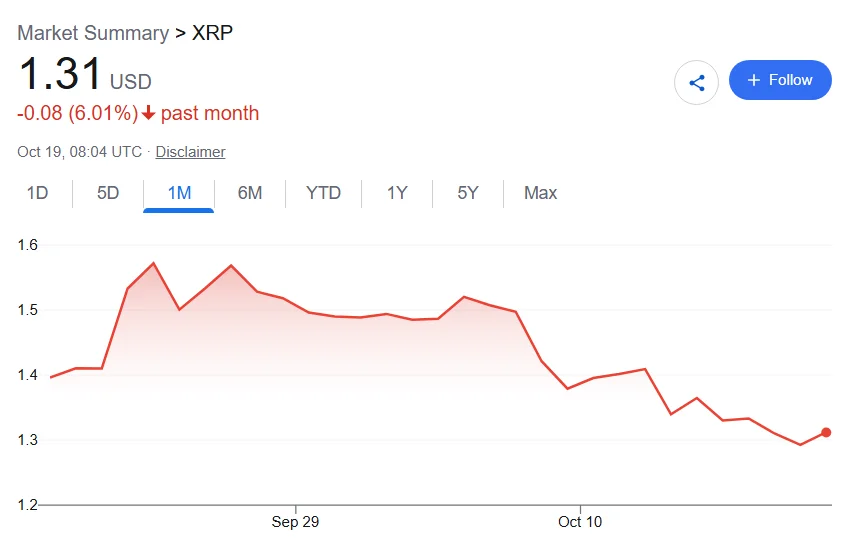
Even Sol’s $1.36 estimate would sit 12.99% below the recent high cited in the article. That comparison places the bullish model’s forecast in context: it suggests a limited recovery from $1.31, not a full reversal of the preceding decline. The figures describe different reference points and periods, so they should not be treated as interchangeable measures of performance.
Chart scenario depends on the $1.25 level
Trading expert Ali Martinez presented a more optimistic conditional scenario in posts on X on October 19. He said XRP could complete a potential inverse head-and-shoulders pattern on a three-day chart if it stayed above $1.25. In his analysis, a rebound could first reach $1.56; a sustained close above that level could then open a path toward $2.
4/5 For $XRP, I’m watching $1.25. Holding this level could complete the right shoulder of a potential inverse head-and-shoulders pattern on the 3-day chart.
— Ali Charts (@alicharts) October 18, 2026
The rebound would still need confirmation: a sustained close above $1.56 could open the path to $2.
Lose $1.25, and $1… pic.twitter.com/CRleLBxDyp
Martinez also described the downside condition: a break below $1.25 would shift his target to $1. The pattern remains a technical interpretation, and the source presents the proposed rebound as conditional on price levels holding and later being cleared. It does not establish that either move will occur.
The figures therefore point to two different ways of framing XRP’s next move. Finbold’s model set clusters around a nearly unchanged price, while Martinez’s chart scenario maps out larger moves in either direction around $1.25 and $1.56. Those levels and forecasts offer reference points for tracking the market; the next observed prices will show whether either framework remains relevant.
Featured image via Shutterstock